Seattle 98103 vs Phoenix 85003
What this report covers
This report provides a comparative analysis of Seattle, WA 98103 and Phoenix, AZ 85003, focusing on crime, health, environmental, and climate data. Consilium Compare utilizes both city and ZIP/ZCTA context, recognizing that crime, health, environmental, and climate factors can cross ZIP boundaries. Seattle has a higher population density of approximately 9,300 residents per square mile compared to Phoenix's 3,100 residents per square mile, which may contribute to a more urban feel and potentially influence local services and exposure to nearby activities. In terms of crime, Seattle exhibits a higher concern level with a score of 9.18 compared to Phoenix's score of 7.49, indicating more reported crime risk in Seattle. Environmental scores also reflect this trend, with Seattle scoring 8.97 versus Phoenix's 8.74, suggesting greater environmental concerns in Seattle. However, Phoenix has more nearby healthcare facilities, with 20 compared to Seattle's 13, which may enhance access to health services for residents. Weather patterns also differ significantly, with Phoenix experiencing a warmer average annual temperature of 74.6°F compared to Seattle's 51.8°F, and Seattle receiving significantly more annual precipitation at 48.3 inches versus Phoenix's 11.7 inches.
0-10 Consilium score - higher means more concern
0-10 Consilium score - higher means more concern; includes industrial-release context where available
EPA index, 1-20 - higher means more walkable
Residents per square mile - city/region context
Economics & housing
ACS 5-year ZIP/ZCTA estimates. Margins of error are shown where the Census Bureau publishes them.
ZIP area 98103 - mean commute 25.9 min - median age 34.7 - 39% family households
ZIP area 85003 - mean commute 19.7 min - median age 37.4 - 28% family households
Crime context & road safety
City/agency baseline context, read alongside sparse ZIP-level signals and NHTSA fatal-crash records only.
EPA-reported on-site chemical releases
Seattle - 3 within 5mi - 27 within 10mi
Phoenix - 24 within 5mi - 42 within 10mi
Severity bands (Minimal / Moderate / Elevated) are Consilium display tiers based on reported on-site release volume, not an EPA hazard rating.
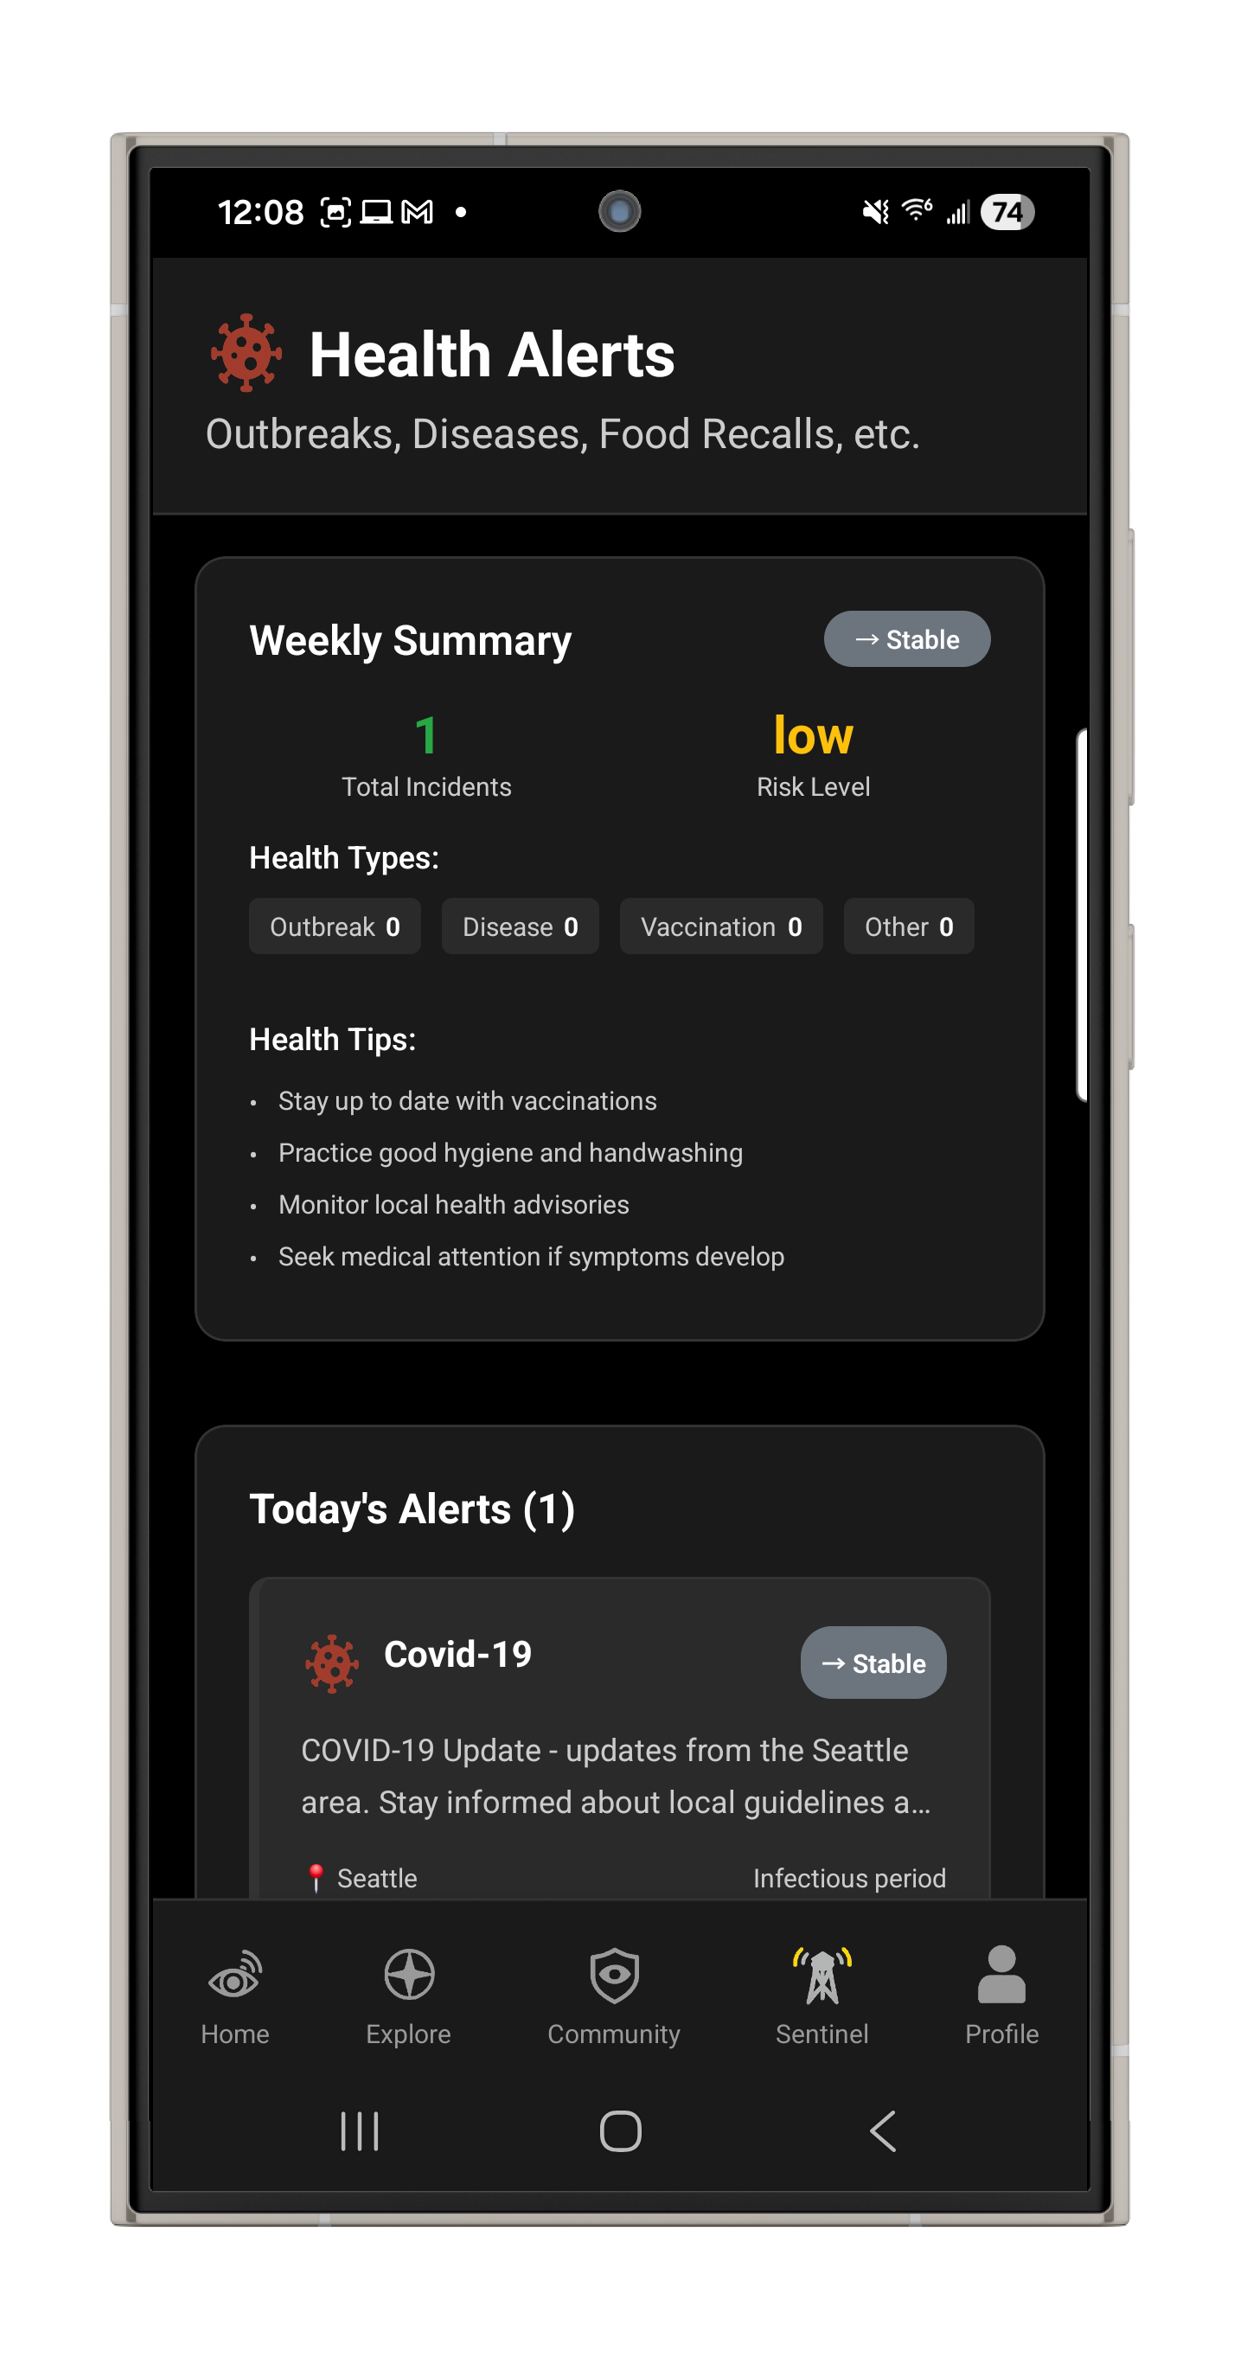
Exclusive Consilium data showing geocoded local incidents surfaced by our monitoring pipeline. Download the Consilium app to explore crime, health, and environmental incidents for the city you care about.


Exact ZIP attribution was not available for this marker set, so Compare is showing nearby geocoded signals around the ZIP/region center instead of claiming they occurred inside the ZIP boundary.


Exact ZIP attribution was not available for this marker set, so Compare is showing nearby geocoded signals around the ZIP/region center instead of claiming they occurred inside the ZIP boundary.
Consilium maps geocoded, jittered incident points around the ZIP or region center. Exact ZIP attribution is shown only when available.
Seattle 98103 traffic fatalities
Phoenix 85003 traffic fatalities
Source: NHTSA Fatality Analysis Reporting System. This includes fatal crashes only, not total crashes or live traffic. ZIP-level counts are sparse, so read them as context, not a safety rating.
Air quality, flood exposure, earthquakes & healthcare access
EPA AQS monitor summaries, FEMA flood-zone overlap, USGS earthquake shaking context, recent earthquake signals, and nearby healthcare facility counts.
Facility count is context, not a claim about quality of care, availability, or appointment access.
Nearby air monitor context
ZIP area 98103 - 3 monitor sites within about 25 mi
Peak NO2 readings are generally in the good range.
Peak ozone values are generally in the good range.
Peak coarse-particle readings are elevated and may indicate episodic air-quality concerns.
Annual fine-particle levels are below the EPA annual standard but worth noting.
Peak SO2 readings are generally in the good range.
Nearby air monitor context
ZIP area 85003 - 4 monitor sites within about 25 mi
Peak NO2 readings are moderate; traffic corridors may still vary block by block.
Peak ozone values are above the common 8-hour reference level; ozone episodes may matter locally.
Peak coarse-particle readings are elevated and may indicate episodic air-quality concerns.
Annual fine-particle levels are above the EPA annual standard benchmark.
Peak SO2 readings are generally in the good range.
Validated historical monitor data, not live AQI. Labels such as Generally good, Moderate / watch, and Elevated are Consilium context labels computed from EPA monitor values, not EPA-provided ratings. Coverage varies; some ZIPs draw on nearby monitors rather than one inside the ZIP.
Mostly minimal mapped flood hazard
ZIP area 98103 - based on FEMA flood-zone area overlap
Mostly moderate flood hazard area
ZIP area 85003 - based on FEMA flood-zone area overlap
ZIP-level flood context is not property-specific. Flood hazard can vary block by block; check the exact parcel or address before purchase.
Seattle 98103 earthquake shaking potential
USGS ASCE7-22 - Risk Category II, Site Class D
USGS estimates the earthquake shaking level engineers use for building-code design at this ZIP centroid. Higher category letters and higher g-values generally mean stronger expected shaking and, all else equal, higher damage potential for vulnerable buildings. ASCE seismic design category D commonly means stronger seismic design requirements for ordinary buildings.
Phoenix 85003 earthquake shaking potential
USGS ASCE7-22 - Risk Category II, Site Class D
USGS estimates the earthquake shaking level engineers use for building-code design at this ZIP centroid. Higher category letters and higher g-values generally mean stronger expected shaking and, all else equal, higher damage potential for vulnerable buildings. ASCE seismic design category is in the lower range for ordinary structures.
USGS values describe expected shaking used for building-code design at the ZIP centroid. They are useful for comparing relative earthquake damage potential, but actual property risk depends on soil, building age, structural system, and retrofit status.
No recent earthquake signals
Seattle 98103 regional seismic signals - last 30 days
No recent earthquake signal detail available.
No recent earthquake signals
Phoenix 85003 regional seismic signals - last 30 days
No recent earthquake signal detail available.
Earthquake activity is recent regional signal context, not a property-specific seismic hazard assessment. Building age, soil, faults, and retrofit status matter for actual risk.
Weather, pollen & walkability
Climate normals, weekly pollen monitoring, and EPA walkability context.
Seattle - climate normals
Hottest Aug · coldest Feb · wettest Dec
Nearest monitor: Seattle - 2.5 mi
Phoenix - climate normals
Hottest Jul · coldest Jan · wettest Jul
Nearest monitor: Scottsdale (AIA) - 9.6 mi
ZIP area 98103
16.8 - Most WalkableZIP area 85003
15.8 - Most WalkableServing districts & nearby public schools
NCES district-boundary overlap and public-school points. This identifies districts and schools only, not ratings.
School district overlap
ZIP area 98103
School district overlap
ZIP area 85003
Each bar is one district layer’s share of this ZIP. The layers cover the same ground, so they are not slices of one pie.
District boundaries can split a ZIP; districts are listed with approximate area share rather than forced to one. School quality ratings are not included.
This week, on the ground
Seven-day forecast plus a plain-language read on what is worth extra attention right now.
Seattle - 48 deg F, Mostly Clear
Suggested viewing: Monday is the better clear-weather look for exterior walkthroughs, neighborhood checks, and natural-light review. Tuesday is the better wet-weather look for drainage, roof and gutter behavior, standing water, and exterior maintenance.
Phoenix - 78 deg F, Slight Chance Showers And Thunderstorms then Chance Showers And Thunderstorms
Suggested viewing: Monday is the better wet-weather look for drainage, roof and gutter behavior, standing water, and exterior maintenance. Wednesday is the better clear-weather look for exterior walkthroughs, neighborhood checks, and natural-light review.
Seattle, WA deserves extra attention this week. The strongest items are in crime and safety, with the most useful reader context around violent crime and crime and safety. For readers, this calls for more deliberate movement around affected blocks, well-lit routes, and checking local updates before lingering near active scenes.
Phoenix, AZ deserves extra attention this week. The strongest items are in crime and safety, with the most useful reader context around violent crime and traffic accidents. For readers, this is a reason to lock your car, keep valuables out of sight, and be more deliberate around parking lots, curbside stops, and evening errands.
Seattle vs. Phoenix - the complete narrative
Long-form comparison, broken into topics instead of one wall of text.
Seattle vs. Phoenix: A Comparative Overview
Density
Seattle and Phoenix differ on a basic measure that shapes much of what follows in this report: population density. Seattle's city limits hold roughly 9,300 residents per square mile; Phoenix, spread across a different land footprint, holds closer to 3,100 residents per square mile. That difference in how people are distributed across land is a useful lens for the crime, environmental, and health data broken down by ZIP code later in this report, though density alone does not determine outcomes in any of those categories. Population density is useful context for interpreting crime, health, and environmental data: research on density and crime is mixed; density plus mobility can shape infectious-disease spread; and built form can interact with heat-island effects and air quality. None of those relationships should be treated as density alone causing the outcome.
Climate and outdoor living
Seattle is in USDA Hardiness Zone 228, while Phoenix is in USDA Hardiness Zone 9b-10a. That gardening-zone context helps frame planting windows, overwintering conditions, and how landscaping choices interact with the ZIP-level weather context below. Outdoor water and landscape constraints also matter: Seattle receives an average annual rainfall of approximately 37 inches, which influences outdoor water use and gardening practices. Seattle was reclassified to USDA hardiness zone 9a in the 2023 update, which is useful evergreen context for gardening and landscape planning. Phoenix is nearly frost-free on paper, but vegetable gardening is constrained by heat; above roughly 85 degrees Fahrenheit, tomatoes can stop ripening properly and pollinator activity can drop, pushing many crops into cool-season and early warm-season windows.
Sun, heat, and outdoor access
During extreme heat events, Seattle activates cooling centers across the city to provide relief for vulnerable populations, particularly in areas identified as heat islands. Maricopa County reported 602 confirmed heat-associated deaths in 2024, during a summer with 113 consecutive days at or above 100 degrees Fahrenheit. That kind of heat context shapes how and when outdoor activity happens locally. Access to green space differs as well: Seattle has approximately 1 park for every 2,000 residents, which is higher than the national average of 1 park for every 3,000 residents. Phoenix ranked 87th out of 100 major cities in the 2026 Trust for Public Land ParkScore index, with about 49.8% of residents within a 10-minute walk of a park.
Public health infrastructure (ports of entry)
Seattle is home to a CDC Port Health Station, part of the federal public health system that monitors international arrivals and communicable disease risk at designated U.S. ports of entry. Seattle is listed by CDC as a Port Health Station location, part of the federal public-health system that monitors communicable-disease risk tied to international arrivals at designated U.S. ports of entry. Phoenix is not listed as a CDC Port Health Station location in the CDC's current station list. Phoenix is not listed by CDC as a Port Health Station location in the current CDC station list. This is not a claim about local disease burden; it is infrastructure context for how international-arrival public health monitoring is distributed.
Crime and Policing
Washington ranked last among states and DC for sworn officers per capita in 2025, at 1.37 officers per 1,000 residents, down from 1.51 in 2011. This is statewide context, not a city police staffing count. Phoenix Police reported about 2,575 sworn officers against an authorized strength of 3,125, a shortage of about 550 officers. FBI-derived baseline crime data for Seattle reports 262 violent crimes per 100,000 residents, 3,704.4 property crimes per 100,000 residents, 5,646 total reported crimes per 100,000 residents. Consilium's stored FBI baseline score is 91.8/100, with a high baseline classification. This is annual city/agency baseline context and should be read alongside the more recent ZIP-level crime signals in the report. FBI-derived baseline crime data for Phoenix reports 244 violent crimes per 100,000 residents, 1,916.6 property crimes per 100,000 residents, 3,255.2 total reported crimes per 100,000 residents. Consilium's stored FBI baseline score is 74.9/100, with a high baseline classification. This is annual city/agency baseline context and should be read alongside the more recent ZIP-level crime signals in the report.
Homelessness
King County's Point-in-Time count reported 18,365 people experiencing homelessness on a given night in 2026, including 11,829 people identified as unsheltered. The Maricopa Regional Continuum of Care reported 9,734 people in the 2025 Point-in-Time count for metro Phoenix. Seattle's encampment removal criteria include hazards, garbage or waste, health hazards, environmental damage, obstruction, difficulty extending emergency services, proximity to special-concern uses, and criminal activity beyond illegal substance abuse; that policy framing means public drug use alone is not described as the same kind of removal trigger as broader criminal activity, obstruction, or safety hazards. Phoenix's largest downtown encampment, the Zone, was cleared after a court order requiring the City to abate tents, makeshift structures, biohazardous materials, and public-order offenses on City-owned property; the Arizona Court of Appeals affirmed the injunction in 2024.
Drug policy
Washington State has legalized the recreational use of marijuana, with regulations in place for its sale and consumption. Arizona legalized recreational marijuana use for adults aged 21 and over in November 2020, allowing possession of up to one ounce of marijuana and cultivation of up to six plants per household. Seattle's local public drug-use enforcement practice is actively disputed, so it should be framed as contested or evolving rather than a settled policy fact. Arizona has implemented various drug treatment programs, including the Arizona Opioid Assistance Program, which provides resources and support for individuals seeking treatment for substance use disorders.
Closing calibration
None of this is presented to suggest one city is objectively safer, healthier, or better managed than the other. It is presented because these are real, source-backed differences in how each city is built, regulated, staffed, and monitored, and they provide useful context for the more granular ZIP-code comparisons that follow.
Crime Comparison
Seattle, WA 98103 has a higher crime concern score of 9.18 compared to Phoenix, AZ 85003, which has a score of 7.49. This indicates that Seattle may experience more reported crime incidents relative to its population. The crime data is based on reported incidents and may not fully represent the safety of each area, as it does not account for unreported crimes or variations in law enforcement practices.
Environmental Comparison
In terms of environmental concerns, Seattle scores 8.97 while Phoenix scores 8.74, indicating that Seattle has a higher level of environmental risk based on TRI data. Seattle has 27 nearby TRI facilities within 10 miles, while Phoenix has 42, suggesting more industrial activity in proximity to Phoenix. However, Seattle's largest reported TRI release is significantly higher at 107,827 pounds compared to Phoenix's 556 pounds, indicating different environmental burdens in these areas. Chemical context is currently regional rather than exact facility-level attribution; nearby TRI activity could include chemicals such as 1,3-Butadiene, 1-Bromopropane, Benzene, Cumene.
Healthcare Access Comparison
Phoenix, AZ 85003 has more nearby healthcare facilities, with a total of 20 compared to Seattle's 13. This includes hospitals, ambulatory surgery centers, and veterans' health facilities, which may enhance access to medical care for residents in Phoenix. However, the report does not provide specific health outcomes or quality of care metrics, focusing instead on the number of facilities available within proximity.
Weather Comparison
Seattle experiences a cooler and wetter climate, with an average annual temperature of 51.8°F and annual precipitation of 48.3 inches. In contrast, Phoenix has a warmer average annual temperature of 74.6°F and significantly less annual precipitation at 11.7 inches. This difference in climate can affect lifestyle choices, outdoor activities, and gardening practices in each city.
This report provides a comparative analysis of Seattle, WA 98103 and Phoenix, AZ 85003, focusing on crime, health, environmental, and climate data. Consilium Compare utilizes both city and ZIP/ZCTA context, recognizing that crime, health, environmental, and climate factors can cross ZIP boundaries. Seattle has a higher population density of approximately 9,300 residents per square mile compared to Phoenix's 3,100 residents per square mile, which may contribute to a more urban feel and potentially influence local services and exposure to nearby activities. In terms of crime, Seattle exhibits a higher concern level with a score of 9.18 compared to Phoenix's score of 7.49, indicating more reported crime risk in Seattle. Environmental scores also reflect this trend, with Seattle scoring 8.97 versus Phoenix's 8.74, suggesting greater environmental concerns in Seattle. However, Phoenix has more nearby healthcare facilities, with 20 compared to Seattle's 13, which may enhance access to health services for residents. Weather patterns also differ significantly, with Phoenix experiencing a warmer average annual temperature of 74.6°F compared to Seattle's 51.8°F, and Seattle receiving significantly more annual precipitation at 48.3 inches versus Phoenix's 11.7 inches.
Know fast. Act calmly.
Use this report for the high-level comparison, then download Consilium for ongoing local crime, health, environmental, recall, and safety intelligence where you live or plan to move.


Free to download. No sensationalized alerts. Unsubscribe from notifications anytime.